Quicklooks for BACSAM II with Polar 6
Author(s) of this notebook:
Laura Köhler, Alfred Wegener Institite, Am Handelshafen 12, 27570 Bremerhaven, Germany, laura
.koehler@awi .de
This notebook is licensed under the Creative Commons Attribution 4.0 International
Dataset description
Title: 100 Hz meteorological nose boom observations from the BACSAM II aircraft campaign with Polar 6 [dataset]
Authors: Köhler, Laura; Hartmann, Jörg
Data hosted by: PANGAEA
Year: 2026
Institute(s): Alfred-Wegener-Institut
DOI: https://
License: Creative Commons Attribution 4.0 International
Contents of this notebook
Quicklooks of turbulence data from polar aircrafts
import matplotlib.pyplot as plt
import matplotlib.colors as mcolors
from matplotlib.collections import LineCollection
import cartopy.crs as ccrs
import cartopy.feature as cfeature
import xarray as xr
import numpy as np
import pandas as pd
import yaml
from scipy.signal import csd, detrend
from mpl_toolkits.mplot3d import Axes3D
campaign_dir = "../Campaigns/20240403BACSAMII/Daten/"Quicklooks
def import_dictionary(yaml_file):
    try:
        with open(yaml_file, "r") as f:
            config = yaml.safe_load(f)
        return config
    except:
        print("yaml file not found or import error!!!")
def plot_wind_arrows(lat, lon, u, v, alt, flight,
track_stride=100,
wind_stride=1000,
wind_avg=500,
scale=0.003):
lat_t = lat.isel(time=slice(None, None, track_stride)).values
lon_t = lon.isel(time=slice(None, None, track_stride)).values
alt_t = alt.isel(time=slice(None, None, track_stride)).values
u_avg = u.rolling(time=wind_avg, center=True, min_periods=1).mean()
v_avg = v.rolling(time=wind_avg, center=True, min_periods=1).mean()
u_w = u_avg.isel(time=slice(None, None, wind_stride)).values
v_w = v_avg.isel(time=slice(None, None, wind_stride)).values
lat_w = lat.isel(time=slice(None, None, wind_stride)).values
lon_w = lon.isel(time=slice(None, None, wind_stride)).values
wspd = np.sqrt(u_w**2 + v_w**2)
# --- Track as LineCollection (altitude color) ---
points = np.array([lon_t, lat_t]).T.reshape(-1, 1, 2)
segments = np.concatenate([points[:-1], points[1:]], axis=1)
norm_alt = mcolors.Normalize(vmin=np.nanmin(alt_t), vmax=np.nanmax(alt_t))
cmap_alt = plt.cm.viridis
# lc = LineCollection(segments, cmap=cmap_alt, norm=norm_alt,
# linewidth=1.2, alpha=0.8, zorder=1) # without cartopy
# --- wind arrows ---
norm_wind = mcolors.Normalize(vmin=np.nanmin(wspd), vmax=np.nanmax(wspd))
cmap_wind = plt.cm.plasma
fig = plt.figure(figsize=(10, 8))
ax = fig.add_subplot(111, projection=ccrs.PlateCarree())
# --- Map ---
# ax.add_feature(cfeature.LAND, facecolor="white")
# ax.add_feature(cfeature.OCEAN, facecolor="lightblue")
ax.add_feature(cfeature.COASTLINE, linewidth=0.5)
# Zoomt automatisch auf den Track
margin = 0.5 # Grad
get_extent_square(ax, lon_t, lat_t)
ax.set_extent([lon_t.min()-margin, lon_t.max()+margin,
lat_t.min()-margin, lat_t.max()+margin])
# --- Track (transform immer angeben!) ---
lc = LineCollection(segments, cmap=cmap_alt, norm=norm_alt,
linewidth=1.5, alpha=0.8, zorder=2,
transform=ccrs.PlateCarree())
lc.set_array(alt_t[:-1])
ax.add_collection(lc)
mask = np.isfinite(u_w) & np.isfinite(v_w)
for i in np.where(mask)[0]:
color = cmap_wind(norm_wind(wspd[i]))
ax.annotate("",
xy=(lon_w[i] + u_w[i]*scale, lat_w[i] + v_w[i]*scale),
xytext=(lon_w[i], lat_w[i]),
arrowprops=dict(arrowstyle="-|>", color=color, lw=1.2))
# --- Colorbars ---
sm_alt = plt.cm.ScalarMappable(cmap=cmap_alt, norm=norm_alt)
sm_alt.set_array([])
cbar_alt = plt.colorbar(sm_alt, ax=ax, shrink=0.6, pad=0.02)
cbar_alt.set_label("altitude (m)")
sm_wind = plt.cm.ScalarMappable(cmap=cmap_wind, norm=norm_wind)
sm_wind.set_array([])
cbar_wind = plt.colorbar(sm_wind, ax=ax, shrink=0.6, pad=0.10)
cbar_wind.set_label("horizontal wind speed (m/s)")
gl = ax.gridlines(draw_labels=True, linewidth=0.3, alpha=0.5)
gl.top_labels = False # only bottom and left
gl.right_labels = False
ax.autoscale()
ax.text(0.5, -0.1, "longitude", transform=ax.transAxes,
ha="center", fontsize=11)
ax.text(-0.1, 0.5, "latitude", transform=ax.transAxes,
ha="center", rotation=90, fontsize=11)
ax.set_aspect("equal")
ax.set_title(f"BACSAM II RF{flight:02}: flight track with wind")
plt.tight_layout()
plt.show()
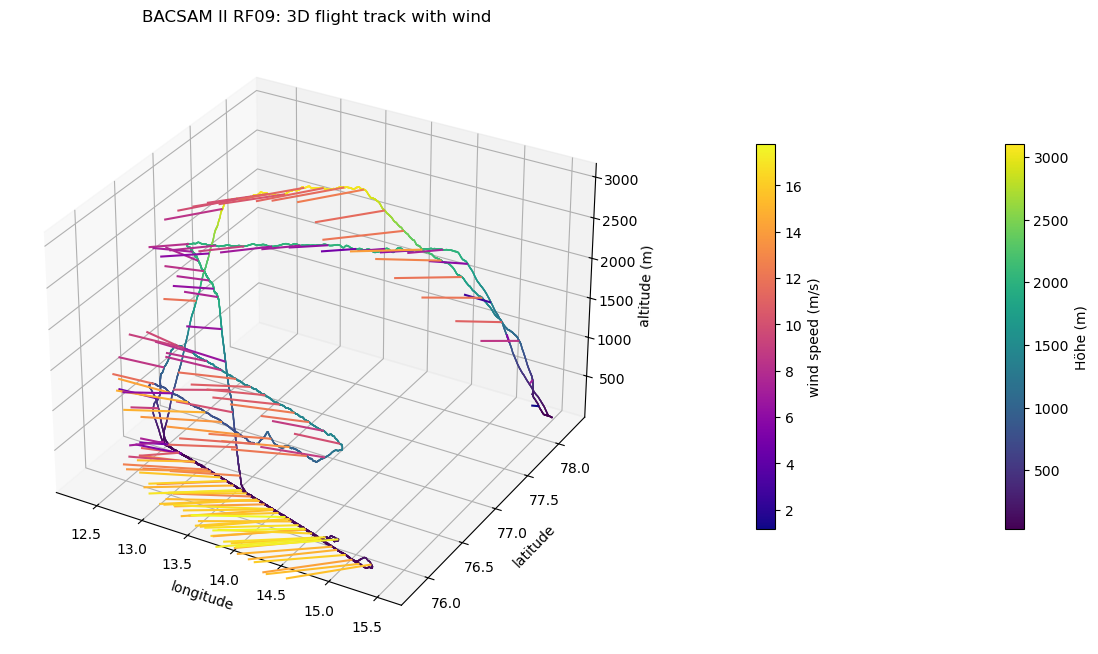
return fig, axdef plot_wind_arrows_3d(lat, lon, u, v, w, alt, flight,
track_stride=100,
wind_stride=1000,
wind_avg=500,
scale=0.003,
scale_z=1.0): # Pfeile vertikal skalieren
lat_t = lat.isel(time=slice(None, None, track_stride)).values
lon_t = lon.isel(time=slice(None, None, track_stride)).values
alt_t = alt.isel(time=slice(None, None, track_stride)).values
u_avg = u.rolling(time=wind_avg, center=True, min_periods=1).mean()
v_avg = v.rolling(time=wind_avg, center=True, min_periods=1).mean()
w_avg = w.rolling(time=wind_avg, center=True, min_periods=1).mean()
u_w = u_avg.isel(time=slice(None, None, wind_stride)).values
v_w = v_avg.isel(time=slice(None, None, wind_stride)).values
w_w = w_avg.isel(time=slice(None, None, wind_stride)).values
lat_w = lat.isel(time=slice(None, None, wind_stride)).values
lon_w = lon.isel(time=slice(None, None, wind_stride)).values
alt_w = alt.isel(time=slice(None, None, wind_stride)).values
wspd = np.sqrt(u_w**2 + v_w**2 + w_w**2)
norm_alt = mcolors.Normalize(vmin=np.nanmin(alt_t), vmax=np.nanmax(alt_t))
norm_wind = mcolors.Normalize(vmin=np.nanmin(wspd), vmax=np.nanmax(wspd))
cmap_alt = plt.cm.viridis
cmap_wind = plt.cm.plasma
fig = plt.figure(figsize=(12, 8))
ax = fig.add_subplot(111, projection='3d')
# --- Track (Segmente einzeln für Höhenfärbung) ---
for i in range(len(lon_t) - 1):
avg_alt = 0.5 * (alt_t[i] + alt_t[i+1])
color = cmap_alt(norm_alt(avg_alt))
ax.plot(lon_t[i:i+2], lat_t[i:i+2], alt_t[i:i+2],
color=color, linewidth=1.0, alpha=0.8)
# --- Windpfeile als quiver ---
mask = np.isfinite(u_w) & np.isfinite(v_w)
colors_wind = [cmap_wind(norm_wind(ws)) for ws in wspd[mask]]
ax.quiver(lon_w[mask], lat_w[mask], alt_w[mask],
u_w[mask] * scale, v_w[mask] * scale, w_w[mask] * scale,
colors=colors_wind,
arrow_length_ratio=0.0,
linewidth=1.5)
# # Pfeilspitzen als Scatter-Punkte am Pfeilende
# lon_end = lon_w[mask] + u_w[mask] * scale
# lat_end = lat_w[mask] + v_w[mask] * scale
# alt_end = alt_w[mask] + w_w[mask] * scale_z
# ax.scatter(lon_end, lat_end, alt_end,
# c=wspd[mask], cmap=cmap_wind, norm=norm_wind,
# s=20, zorder=5, depthshade=True)
# --- Colorbars (als separate Axes) ---
sm_alt = plt.cm.ScalarMappable(cmap=cmap_alt, norm=norm_alt)
sm_alt.set_array([])
plt.colorbar(sm_alt, ax=ax, shrink=0.5, pad=0.1, label="Höhe (m)")
sm_wind = plt.cm.ScalarMappable(cmap=cmap_wind, norm=norm_wind)
sm_wind.set_array([])
plt.colorbar(sm_wind, ax=ax, shrink=0.5, pad=0.15, label="wind speed (m/s)")
ax.set_xlabel("longitude")
ax.set_ylabel("latitude")
ax.set_zlabel("altitude (m)")
ax.set_title(f"BACSAM II RF{flight:02}: 3D flight track with wind")
plt.tight_layout()
plt.show()
return fig, axPlots
flight = 3
config_fn = "../bacsam2_processing/config_bacsam2.yaml"
config = import_dictionary(config_fn)

try:
    cal_segs = config["flights"][flight]["calibration"]
except:
    print("no calibration segments during this flight")
    cal_segs = {}

date_dict = {1: "20240407", 2: "20240410", 3: "20240411", 40: "20240413", 41: "20240413", 42: "20240413", 5: "20240415", 6: "20240417", 7: "20240423", 8: "20240424", 9: "20240425", 10: "20240426", 11: "20240429"}

date = date_dict[flight]

fn = f"{campaign_dir}/Prozessierung/noseboom/BACSAM2_{date}_RF{flight:02}_noseboom_100Hz.nc"
#fn = f"/Users/lakoeh001/AWI/Campaigns/20260103SANAT/Daten/Prozessierung/SANAT_{date}_RF{flight:02}_noseboom_100Hz.nc"
proc = xr.open_dataset(fn)

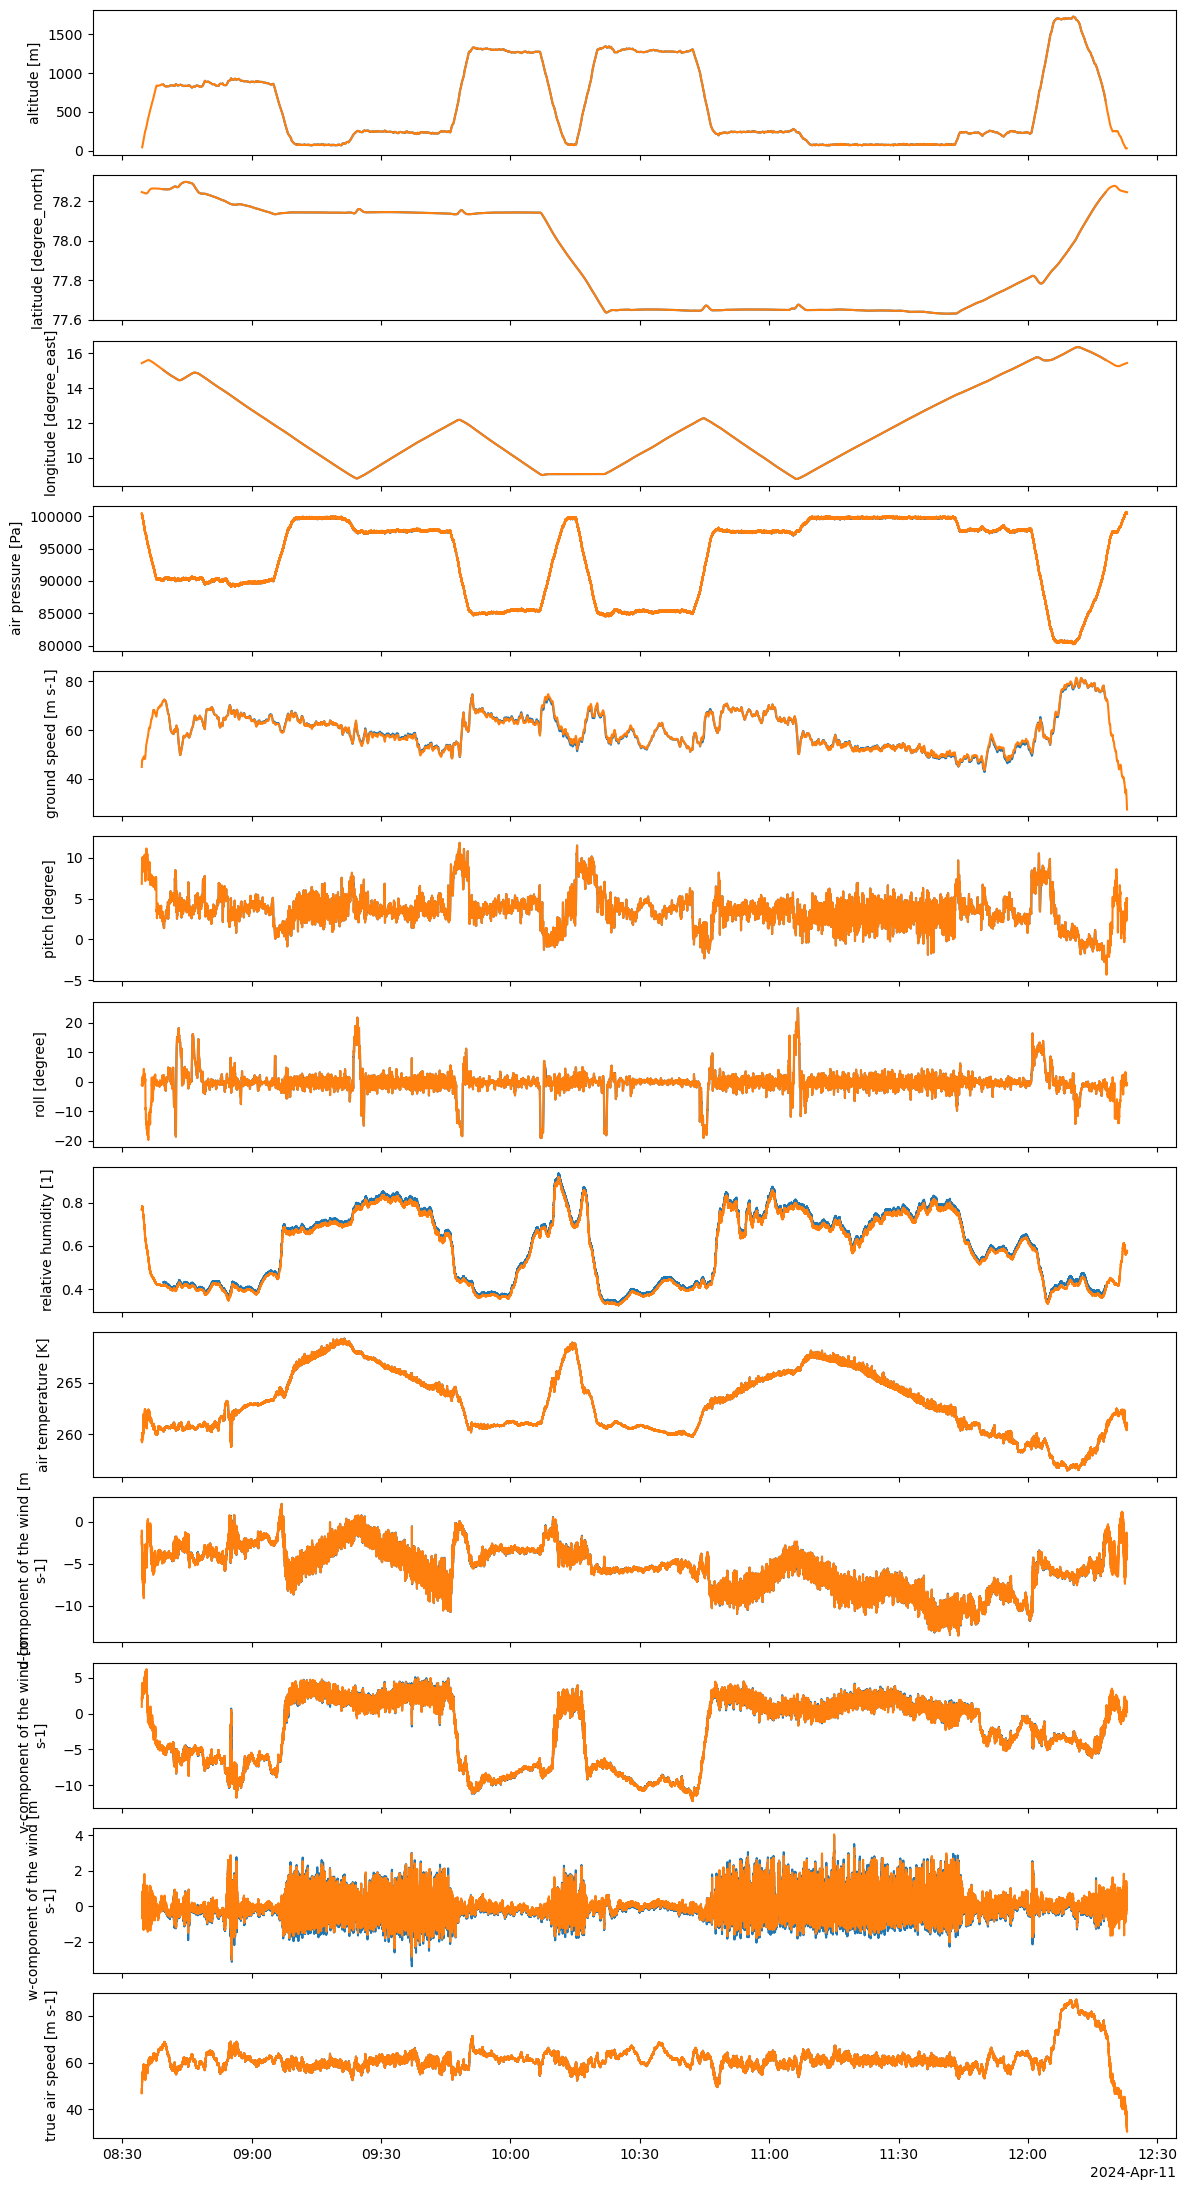
fig, axs = plt.subplots(13,1,figsize=(12,22),sharex=True)

if compare2joerg:
    varnames_joerg = { 'alt': 'h', 'lat': 'lat', 'lon':'lon', 'p_air':'p', 'gs':'gs', 'pitch':'pitch', 'roll':'roll', 'rh':'rh', 't_air': 'T', 'u':'u', 'v': 'v', 'w':'w', 'taspd':'tas'}
    for v, ax in zip(list(proc.keys()), fig.get_axes()):
        if v == "rh":
            data2plot = ref[varnames_joerg[v]] /100
        elif v == "t_air":
            data2plot = ref[varnames_joerg[v]] + 273.15
        elif v == "p_air":
            data2plot = ref[varnames_joerg[v]] *100
        else:
            data2plot = ref[varnames_joerg[v]]
        data2plot.sel(time = slice(proc.time.min() + np.timedelta64(5,"m"),proc.time.max() - np.timedelta64(5,"m"))).plot(ax = ax)

for v, ax in zip(list(proc.keys()), fig.get_axes()):
    proc[v].plot(ax = ax)
    ax.set_xlabel("")

for ax in fig.get_axes():
    for key, val in cal_segs.items():
        start = val['start']
        stop = val['stop']

        # optional: different colors for "out" vs "ret"
        color = 'red' if 'out' in key else 'blue'

        ax.axvspan(start, stop, alpha=0.2, color=color)

plt.tight_layout()

#plt.savefig(f"{campaign_dir}/Prozessierung/plots/BACSAM2_noseboom_RF{flight:02}.png")
no calibration segments during this flight
/var/folders/j4/fclf6j0x39j3cnr71ql3kg0r4jskdr/T/ipykernel_30955/1924307033.py:27: FutureWarning: The 'delim_whitespace' keyword in pd.read_csv is deprecated and will be removed in a future version. Use ``sep='\s+'`` instead
  data_jeorg = pd.read_csv(file,delim_whitespace=True, comment="!", names=colnames,)
flightnumber_dict = {1: 1, 2: 2, 3: 3, 40: 4, 41: 5, 42: 6, 5: 7, 6: 8, 7: 9, 8: 10, 9: 11, 10: 12, 11: 13}
date_dict = {1: "20240407", 2: "20240410", 3: "20240411", 40: "20240413", 41: "20240413", 42: "20240413", 5: "20240415", 6: "20240417", 7: "20240423", 8: "20240424", 9: "20240425", 10: "20240426", 11: "20240429"}

for flight in [1, 2, 3, 40, 41, 42, 5, 6, 7, 8, 9, 10, 11]:
    date = date_dict[flight]
    flight_joerg = flightnumber_dict[flight]

    fn = f"{campaign_dir}/Prozessierung/noseboom/BACSAM2_{date}_RF{flight:02}_noseboom_100Hz.nc"
    proc = xr.open_dataset(fn)

    file = f"{campaign_dir}/Turbulenz/Met_100Hz_Polar6_TB/Flight_{date}_P6_{flight_joerg:02}_100Hz.asc"
    with open(file, "r") as f:
        colnames = f.readline().strip()[1:].split()

    # Only read needed columns
    needed = ["UTC", "u", "v", "w"]
    usecols = [colnames.index(c) for c in needed]
    data_joerg = pd.read_csv(file, sep=r"\s+", comment="!", header=None,
                             usecols=usecols, names=needed, engine="c")

    # Faster time conversion
    base = np.datetime64(f"{date[:4]}-{date[4:6]}-{date[6:]}", "ns")
    times = (np.datetime64(f"{date[:4]}-{date[4:6]}-{date[6:]}") + (data_joerg["UTC"].values * 1e3).astype("int64") * np.timedelta64(1, "ms")).astype("datetime64[ns]")

    # Build xarray directly without going through pandas index
    ref = None
    ref = xr.Dataset(
        {v: ("time", data_joerg[v].values) for v in ["u", "v", "w"]},
        coords={"time": times}
    )
#    ref = ref.sel(time=slice(proc.time.min(), proc.time.max()))
    ref["w"] = ref.w - ref.w.mean()
    ref = ref.interp(time=proc.time)

    print(f"RF{flight:02}:")
    for v in ["u", "v", "w"]:
        diff = (proc[v] - ref[v]).sel(time = slice(proc.time.min() + np.timedelta64(5,"m"), proc.time.max() - np.timedelta64(5,"m"))).values
        mask = np.isfinite(diff)
        diff = diff[mask]
        bias = diff.mean()
        mae  = np.abs(diff).mean()
        rmse = np.sqrt((diff**2).mean())
        print(f"    {v}: bias = {bias:.4f} m/s, mae = {mae:.4f} m/s, rmse = {rmse:.4f} m/s")
RF01:
u: bias = 0.0015 m/s, mae = 0.0361 m/s, rmse = 0.0492 m/s
v: bias = -0.0003 m/s, mae = 0.0455 m/s, rmse = 0.0592 m/s
w: bias = -0.0166 m/s, mae = 0.0273 m/s, rmse = 0.0390 m/s
RF02:
u: bias = -0.0006 m/s, mae = 0.0608 m/s, rmse = 0.0779 m/s
v: bias = 0.0000 m/s, mae = 0.0248 m/s, rmse = 0.0350 m/s
w: bias = -0.0327 m/s, mae = 0.0427 m/s, rmse = 0.0553 m/s
RF03:
u: bias = 0.0004 m/s, mae = 0.0324 m/s, rmse = 0.0488 m/s
v: bias = -0.0050 m/s, mae = 0.0788 m/s, rmse = 0.1092 m/s
w: bias = -0.0367 m/s, mae = 0.0697 m/s, rmse = 0.0978 m/s
RF40:
u: bias = 0.0469 m/s, mae = 0.0493 m/s, rmse = 0.0564 m/s
v: bias = 0.0458 m/s, mae = 0.0499 m/s, rmse = 0.0579 m/s
w: bias = -0.0473 m/s, mae = 0.0491 m/s, rmse = 0.0546 m/s
RF41:
u: bias = -0.0000 m/s, mae = 0.0461 m/s, rmse = 0.0552 m/s
v: bias = 0.0000 m/s, mae = 0.0172 m/s, rmse = 0.0228 m/s
w: bias = -0.0199 m/s, mae = 0.0273 m/s, rmse = 0.0350 m/s
RF42:
u: bias = -0.0462 m/s, mae = 0.0510 m/s, rmse = 0.0620 m/s
v: bias = -0.0469 m/s, mae = 0.0558 m/s, rmse = 0.0729 m/s
w: bias = -0.0213 m/s, mae = 0.0299 m/s, rmse = 0.0435 m/s
RF05:
u: bias = -0.0013 m/s, mae = 0.0445 m/s, rmse = 0.0623 m/s
v: bias = 0.0005 m/s, mae = 0.0379 m/s, rmse = 0.0550 m/s
w: bias = -0.0105 m/s, mae = 0.0327 m/s, rmse = 0.0487 m/s
RF06:
u: bias = -0.0010 m/s, mae = 0.0464 m/s, rmse = 0.0585 m/s
v: bias = 0.0003 m/s, mae = 0.0364 m/s, rmse = 0.0504 m/s
w: bias = -0.0256 m/s, mae = 0.0314 m/s, rmse = 0.0402 m/s
RF07:
u: bias = -0.0046 m/s, mae = 0.0606 m/s, rmse = 0.0986 m/s
v: bias = 0.0043 m/s, mae = 0.0624 m/s, rmse = 0.0954 m/s
w: bias = -0.0335 m/s, mae = 0.0541 m/s, rmse = 0.0724 m/s
RF08:
u: bias = 0.0020 m/s, mae = 0.0473 m/s, rmse = 0.0653 m/s
v: bias = 0.0001 m/s, mae = 0.0499 m/s, rmse = 0.0722 m/s
w: bias = -0.0323 m/s, mae = 0.0427 m/s, rmse = 0.0553 m/s
RF09:
u: bias = 0.0013 m/s, mae = 0.0861 m/s, rmse = 0.1185 m/s
v: bias = -0.0082 m/s, mae = 0.0689 m/s, rmse = 0.1003 m/s
w: bias = -0.0313 m/s, mae = 0.0668 m/s, rmse = 0.0978 m/s
RF10:
u: bias = -0.0010 m/s, mae = 0.0666 m/s, rmse = 0.0808 m/s
v: bias = 0.0037 m/s, mae = 0.0347 m/s, rmse = 0.0663 m/s
w: bias = -0.0340 m/s, mae = 0.0443 m/s, rmse = 0.0604 m/s
RF11:
u: bias = -0.0024 m/s, mae = 0.0546 m/s, rmse = 0.0778 m/s
v: bias = 0.0025 m/s, mae = 0.0556 m/s, rmse = 0.0765 m/s
w: bias = -0.0967 m/s, mae = 0.1015 m/s, rmse = 0.1143 m/s
fig, ax = plot_wind_arrows(proc.lat, proc.lon, proc.u, proc.v, proc.alt, flight,
                           track_stride=100,   # every 1 s a track point
                           wind_stride=12000,   # draw every 2 min an arrow
                           wind_avg=1000,       # 10s average
                           scale=0.02)        # Arrow scale (adjust)

#fig.savefig(f"{campaign_dir}/Prozessierung/plots/BACSAM2_windontrack_noseboom_RF{flight:02}.png", bbox_inches='tight')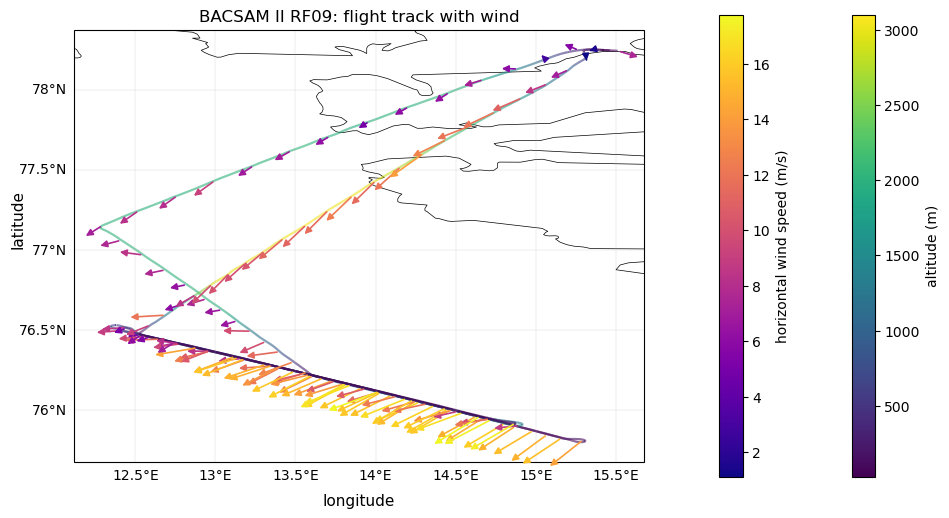
fig, ax = plot_wind_arrows_3d(proc.lat, proc.lon, proc.u, proc.v, proc.w, proc.alt, flight,
                           track_stride=100,   # every 1 s a track point
                           wind_stride=12000,   # draw every 2 min an arrow
                           wind_avg=1000,       # 10s average
                           scale=0.05)        # Arrow scale (adjust)

#fig.savefig(f"{campaign_dir}/Prozessierung/plots/BACSAM2_windontrack_3d_noseboom_RF{flight:02}.png", bbox_inches='tight')