This example script was provided as part of the Data Management Project (INF) within the TR-172 “ArctiC Amplification: Climate Relevant Atmospheric and SurfaCe Processes, and Feedback Mechanisms” (AC)³ funded by the German Research Foundation (Deutsche Forschungsgemeinschaft, DFG)
Author: Melanie Lauer, Institute of Geophysics and Meteorology, University of Cologne, Germany, melanie
Github repository: https://
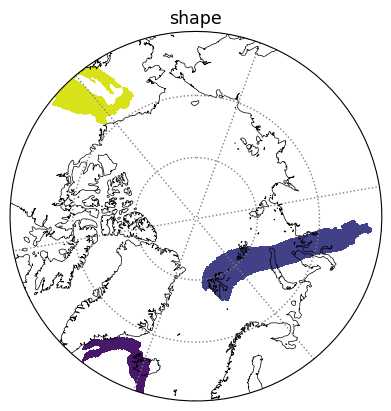
Shape of Atmospheric Rivers
Dataset resources
Title: Shape of atmospheric rivers for ERA5 reanalysis
Author: Melanie Lauer
Year: 2023
Institute: Institute of Geophysics and Meteorology - University of Cologne
DOI: Lauer et al. (2023)
License: Creative Commons Attribution 4.0 International
Contents of this notebook
Illustration of the Atmospheric Rivers shape.
Modules
import numpy as np
import matplotlib.pyplot as plt
import cartopy.crs as ccrs
import cartopy
import netCDF4
import matplotlib.path as mpath
import pangaeapy as pgp
import nest_asyncio
nest_asyncio.apply()
ds = pgp.PanDataSet(957161, enable_cache=True)
filenames = ds.download(columns=['Binary'], indices=[38])
[INFO] Cache directory set to: E:\tmp\pangaeapy_cache
[INFO] To change the cache directory permanently, edit: C:\Users\Johannes\.config\pangaeapy\config.toml
Downloading files to E:\tmp\pangaeapy_cache
globalAR_ERA5_201701_201712_hourly_v2.0.nc is being retrieved from tape. Retrying in 30 seconds...
Downloaded globalAR_ERA5_201701_201712_hourly_v2.0.nc successfully!
data_AR = netCDF4.Dataset(filenames[0])

shape_AR = data_AR.variables['shape'][3565,0,:,:] #3656 == 29 May 2017  12 UTC

#reshape lon
shape = np.empty(shape_AR.shape)
shape[:,0:720] = shape_AR[:,720:1440]
shape[:,720:1440] = shape_AR[:,0:720]

shape = np.where(shape < 0, np.nan, shape)
print(np.nanmin(shape))

lat = data_AR.variables['lat'][:]
lon = np.arange(-180,180,0.25)


print(np.nanmin(shape))
print(np.nanmax(shape))
1.0
1.0
19.0
Plotting example
fig = plt.figure()#figsize=(5, 3))

ax = plt.subplot(1,1,1, projection=ccrs.NorthPolarStereo())

#plot ax1
ax.set_extent([-180, 180, 60, 90], crs=ccrs.PlateCarree())
ax.coastlines(linewidth=0.5,color='k')
ax.gridlines(color='C7',lw=1,ls=':',xlocs=[],ylocs=[60,70,80])
ax.gridlines(color='C7',lw=1,ls=':',draw_labels=False,rotate_labels=False,xlocs=range(-140,161,60),ylocs=[])

#North Polar as circle
theta = np.linspace(0, 2*np.pi, 100)
center, radius = [0.5, 0.5], 0.5
verts = np.vstack([np.sin(theta), np.cos(theta)]).T
circle = mpath.Path(verts * radius + center)
ax.set_boundary(circle, transform=ax.transAxes)


ax.contourf(lon, lat, shape, transform=ccrs.PlateCarree())#NorthPolarStereo())
ax.set_title('shape',fontsize=12.5)
- Lauer, M., Mech, M., & Guan, B. (2023). Global Atmospheric Rivers catalog for ERA5 reanalysis. PANGAEA. 10.1594/PANGAEA.957161